Solar payback
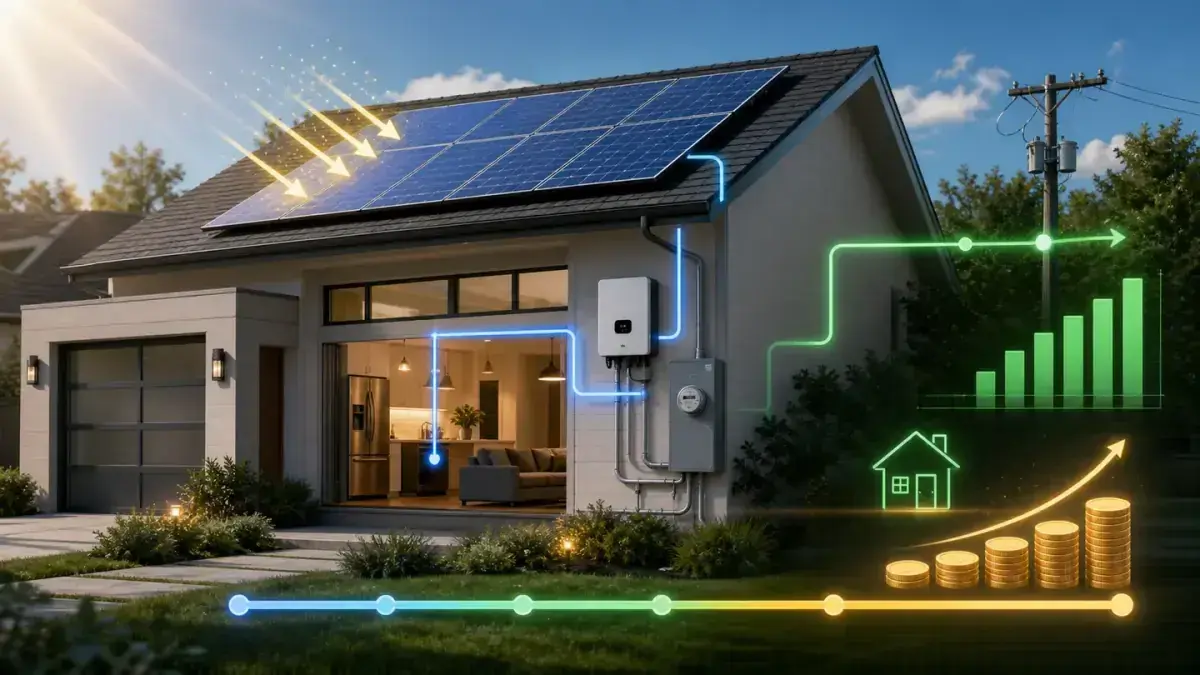
Solar Payback Calculator
Standalone payback calculator for residential solar. 25-year cashflow model including degradation, rate escalation, net metering tier, and inverter replacement.
Quick answer: typical residential solar payback in 2026 is 8–14 years. States with cheap electricity push it to 18–22 years. States with strong net metering and expensive power hit 6–10 years. The federal 25D credit expired Dec 31 2025; install cost is higher in 2026 without it.
Optional — auto-sets state
US median residential: 8 kW (LBNL 2024)
US median 2024: $3.50/W (LBNL)
EIA AEO 2024 reference: ~3.5%/yr
With 10 kWh battery: ~75%
Payback analysis · 8 kW · Texas
16 yr
simple payback at current rates
Year-1 revenue
$1,498
25-yr profit
$24,476
25-yr ROI
87%
Net cost breakdown
- Gross install cost$28,000
- Federal 25D credit (expired 2025-12-31)−$0
- Net cost$28,000
- Inverter replacement (year 12)$2,000
Key assumptions
- · Year-1 production: 10,400 kWh
- · Panel degradation: 0.5%/yr (modern Tier-1)
- · Electricity escalation: 3.5%/yr
- · NEM credit rate: 100% of retail
- · Self-consumption: 35%
- · Inverter replacement: year 12, $0.25/W
- · 25-year horizon, no resale value
Cashflow over 25 years (every 5 yr)
| Year | Annual | Cumulative |
|---|---|---|
| Year 1 | $1,498 | $1,498 |
| Year 5 | $1,684 | $7,948 |
| Year 10 | $1,951 | $17,154 |
| Year 15 | $2,260 | $27,818 |
| Year 20 | $2,618 | $40,170 |
| Year 25 | $3,032 | $54,476 |
New to solar economics?
Solar payback is the year when cumulative electricity savings equal the net installed cost. The math depends on five things: system size (kW), installed cost per watt, your state’s annual production (kWh per kW), your electricity rate (and how it escalates), and your net-metering policy (how much credit you get for exported power). The calculator above models all five over a 25-year horizon, including panel degradation, inverter replacement at year 12, and electricity-rate escalation.
Read the full guide 9-min read · 25-year math · NEM policy · cash vs loan · what changes payback
Frequently asked questions
How long until solar pays for itself?
Typical residential solar payback in 2026 falls between 8 and 14 years depending on state, electricity rate, system cost, and net-metering policy. States with cheap electricity (WA, ID, KY, LA) and weak net metering can push payback to 18-22 years. States with expensive electricity and strong NEM (HI, MA, CT, NY, CA pre-NEM 3.0) hit 6-10 year paybacks. The federal 25D credit expired Dec 31 2025, lengthening payback by 2-4 years for 2026+ installs.
Does solar still make sense without the federal credit?
Yes, in many states. Without the 30% federal credit, an $24,000 8 kW system costs $24,000 instead of $16,800 net. Payback extends by 2-4 years, and 25-year ROI drops from ~250% to ~150%. Still positive. State-level credits (NY 25%, MD 30%, NC 35%, IA 18%, MA SMART production-based) close part of the gap in those states. The 25D residential clean energy credit expired for systems installed after 2025-12-31 under OBBBA; some state programs survived.
What happens to my net metering credits over time?
NEM 1.0 (1:1 retail rate credit) is being phased out in many states. CA NEM 3.0 (effective April 2023) cut export rates ~75% for new installs. NV and HI have similar partial-NEM tariffs. Net metering policy is the single biggest variable in solar economics — same panels in a 1:1-NEM state vs a tariff-NEM state can have 30-50% different lifetime returns. Check your state utility’s current NEM tariff before signing.
Should I add a battery to improve solar payback?
In strong-NEM states (1:1 credit), batteries hurt solar payback — you’re paying $10,000–$18,000 for storage when the grid already credits exports at retail. In partial-NEM or tariff states (CA NEM 3.0, HI, NV), batteries raise self-consumption from ~35% to ~75%, materially improving solar ROI. Run both scenarios in the calculator with different self-consumption percentages.
What about inverter replacement and maintenance?
String inverters typically need replacement at year 10-15 ($1,500–$3,000 for an 8 kW system, $0.25/W typical). Microinverters carry 25-year warranties — no scheduled replacement. Annual maintenance is essentially zero for the first 10 years, then $100-300/yr for cleaning and minor repairs. Insurance is usually covered under your homeowner’s policy; some states require a small rider for hail.